Precision agriculture has evolved over the last decade. Today there are more data collection sources than ever. Farmers continue to find new ways to use this data to improve profitability. Instead of a handful of data collection tools like satellite imagery and yield mapping, now farmers have more choices. These include yield monitors, harvest automation, weather analytics, drones, autonomous tractors, and others.
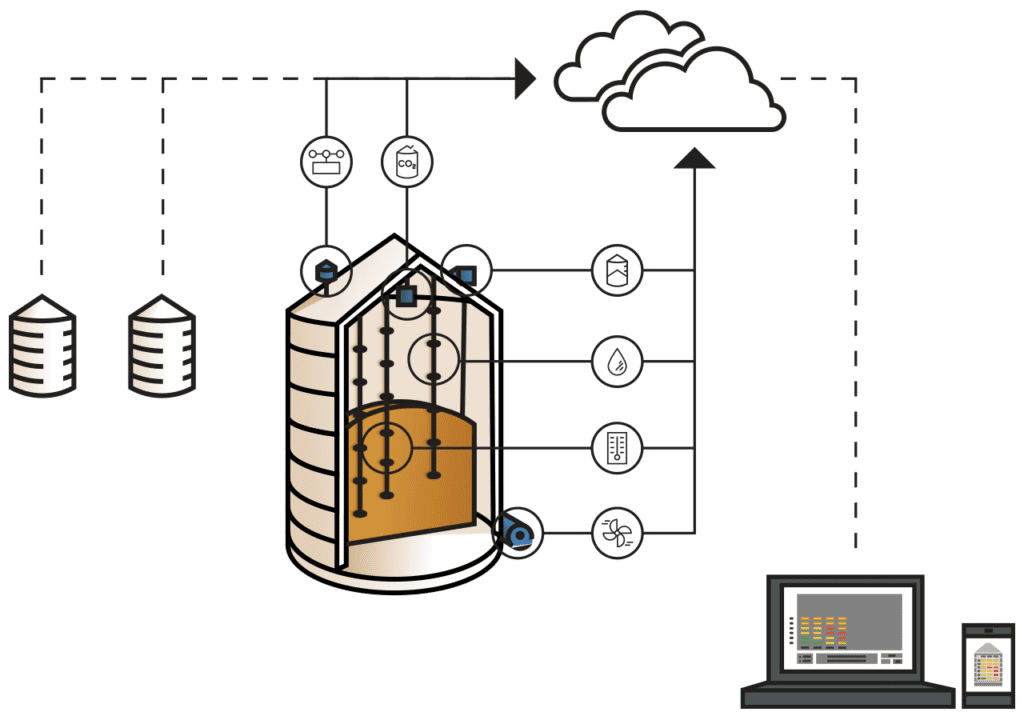
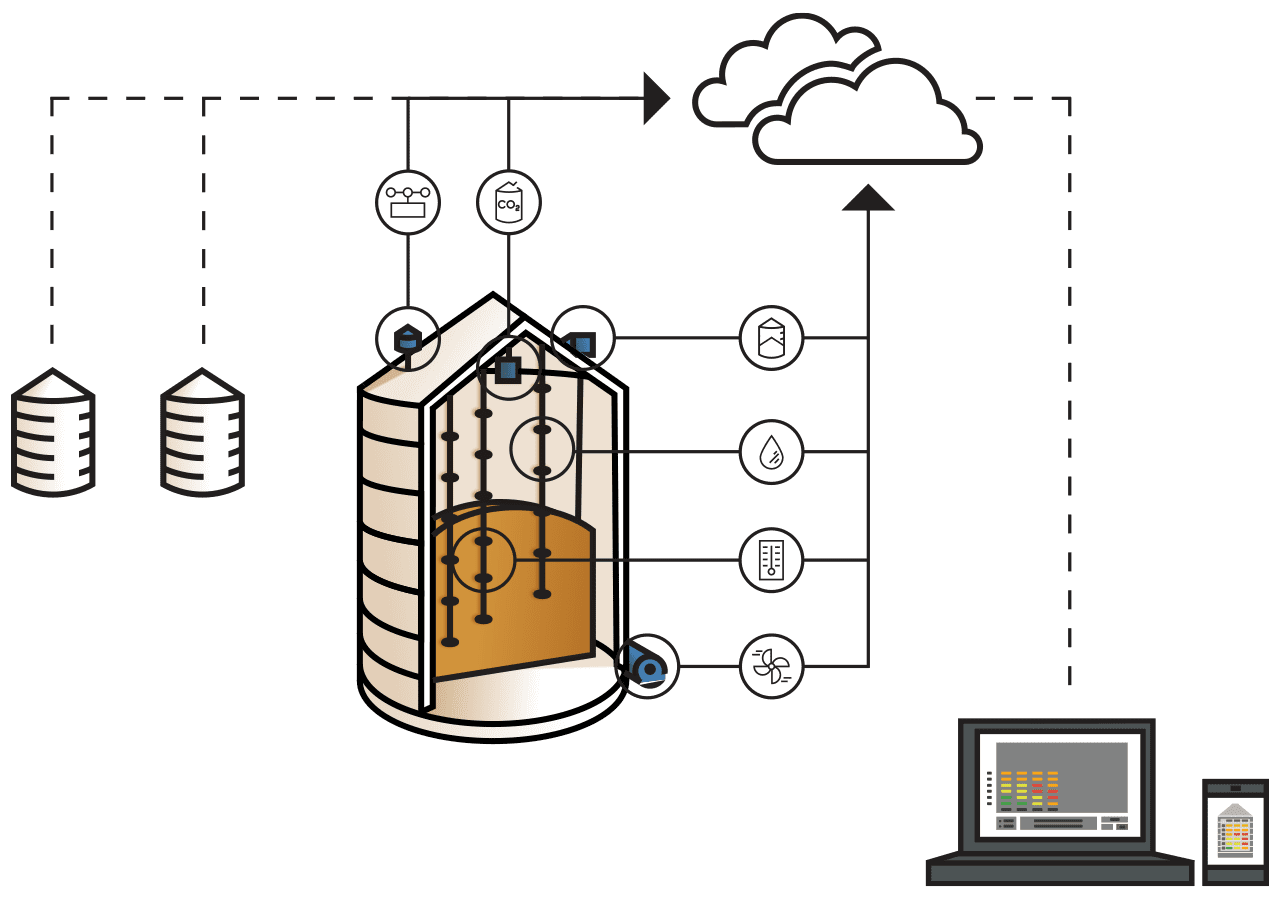
Additionally, there is a diverse mix of systems that monitor aspects of farm production via sensors. From subsoil temperature to stored grain temperature – there’s a sensor for that.
These data collecting tools provide great insights into farm production. They allow farmers to make informed decisions based on live actionable data. Agronomists can measure their production – the areas of profitability and the areas of loss. They can see what is working and what is not working, what is needed, and what needs to be changed.
These invaluable insights allow farmers to increase their profit margins while lowering their production costs.
Data Collection in Precision Agriculture – Three Standard Forms
There are three standard forms of data that are available to farmers.
The first is, publicly sourced – data that is free and available to anyone. This includes topographical maps, soil maps, and legal land surveys, among others.
The second is grower generated – data collected from equipment like seeding and yield monitors, sprayer and fertilization applicators, and variable rate technology.
The third is sensory – data collected using probes or sensors like soil sensors, weather stations, and stored grain temperature sensors.
New in Precision Agriculture – Systems Used to Evaluate and Interpret Data
The biggest obstacle to data collection is analyzing and interpreting the information in a way that benefits the farmer. Essentially, we have more ways to collect data than ever, but what good is that information without effective application? Thankfully, precision agriculture has grown substantially in software and application development. In today’s market, there are several platforms that combine farm production data in one place.
One example of this is Climate FieldView, a digital data management system created by Bayer Crop Science. This platform helps growers view and evaluate parcel maps and crop production data to aid in management decisions. From seeding to harvest, farmers can manage and adjust their crop management throughout the growing season to optimize yield returns. It can help create a baseline plan for the years to come.
Tools like FieldView help farmers make informed decisions for their fields and help them to create management zones. Additionally, they track what is being done and the results those decisions breed. This is best explained by Derek Freitag, a market development lead who works with Bayer Crop Science.
As he tells it, “you can create zones and an application map, but if you can’t go back at the end of the season and see the results of what you did in a field, how do you know if you are managing those zones the way they should be managed and making the right decisions using the right products in the right areas?”
Essentially, these data evaluation tools give the farmer the ability to go back and look at what’s been tried and proved successful or unsuccessful. These results are what will help farmers improve their yields and cut down on costs.
The Value of Data – What Can You Expect
The value of data analysis is its spatial lens says, Devin Dubois, CEO of FieldAlytics, a platform similar to Climate FieldView. For him, “the higher value is from putting your farm into a spatialized digital system, so you can measure your production and see where you are losing money and where you are gaining money.”
Typically, when it comes to farm analysis and planning, producers take all their revenue and cost data to their accountant. They opt for a farm, field, or crop variety margin and that’s that. But when agronomists only think about overall margins, they can’t identify or address the problems they face.
This is because typically when a farm, field, or crop unit analysis is done it’s only showing a global number. Meaning, from an economic perspective you may appear to be doing well. But if things were to be looked at from a spatial lens, you may find that 20% of your land is losing money. Which is what one U.S. economic study determined – roughly 20% of seeded soybean and corn acres didn’t make a profit. This means that although your entire field is churning a profit, areas of that field are losing money.
Precision Agriculture’s Bottom Line
Bottom line, good or bad production doesn’t occur in hundreds of acre measurements. It happens in the five acres here or the twelve acres there. If you can determine where you’re losing and identify where you’re having great success, you can close the gaps. That’s where this data has value – it shows you where things are going right, and where they’re going wrong. Then you can tend to the wrong by looking at the right, and that is the beauty of precision agriculture.
Ask us about grain temperature monitoring systems here, live chat with us here, or call us at 1 800 438 8367.
Follow us on Facebook where we discuss a variety of farming topics, including grain temperature monitoring and Smart Farming.


